Interactive personal knowledge graph for a service robot cooperated with Intel

Interactive Personal Knowledge Graph

Ongoing now, Started from June, 2018

Project Abstract

In order to support service robot to accomplish its tasks effectively, it is important to develop a personalized knowledge graph about the working environment and people it serves. However, the information error, missing, confusion, and conflicts caused by its small data-based nature all posit big challenges in personalized knowledge graph construction. In this project, we present a method of utilizing visual analysis technology to bring user input into the construction of the personalized knowledge graph. Specifically, we introduce the concept of “Working knowledge graph” and tremendously lower down the number of nodes presented to the user. At the same time, we use hyperbolic projection to enable a smooth association of nodes in the Working Knowledge Graph with those in long-term personalized knowledge graph. The effect of this interactive visualization in supporting personalized knowledge graph construction is evaluated in a controlled usability test and exhibits a positive result.


My Development Experience in Knowledge Graph

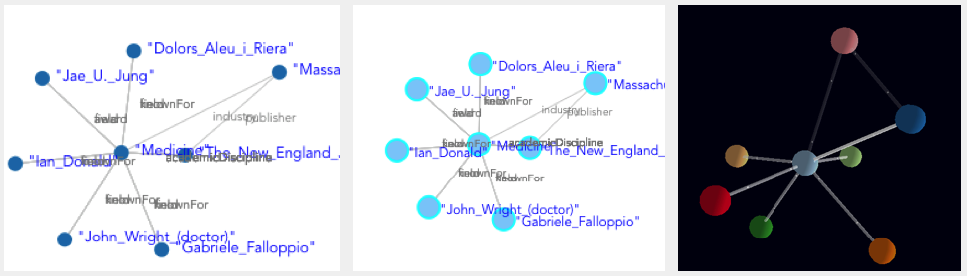
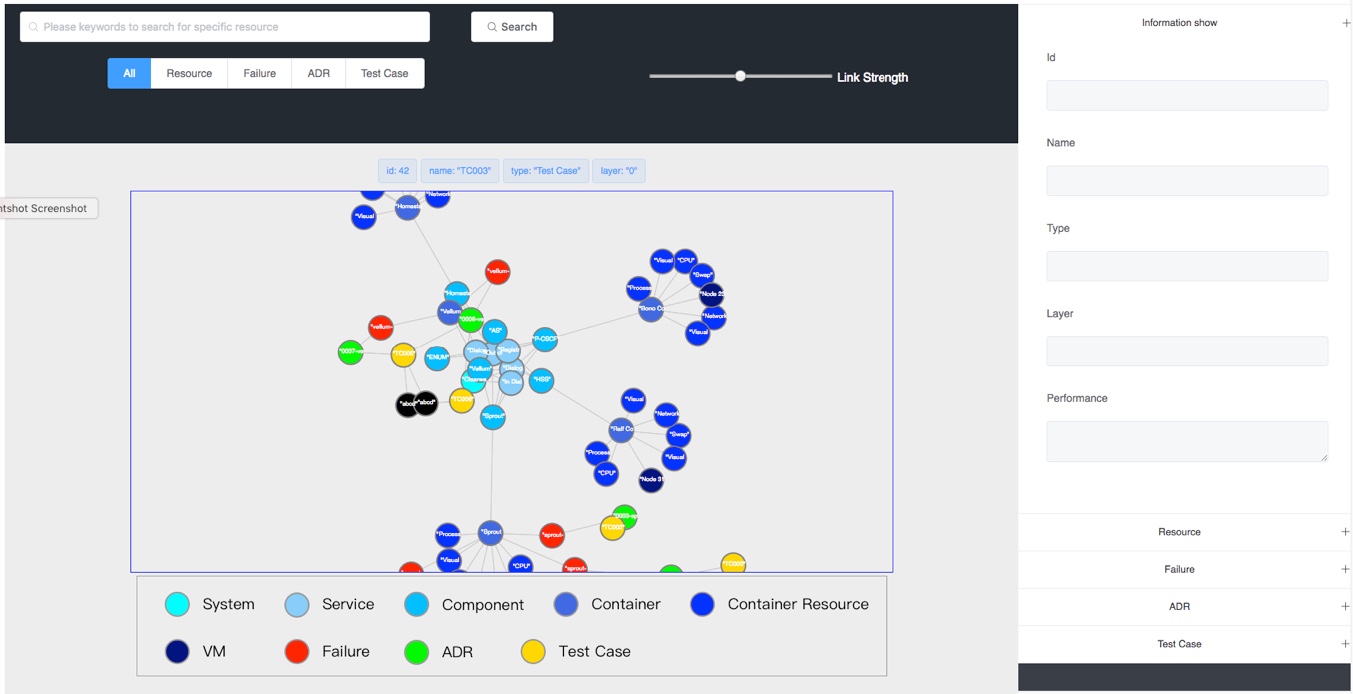
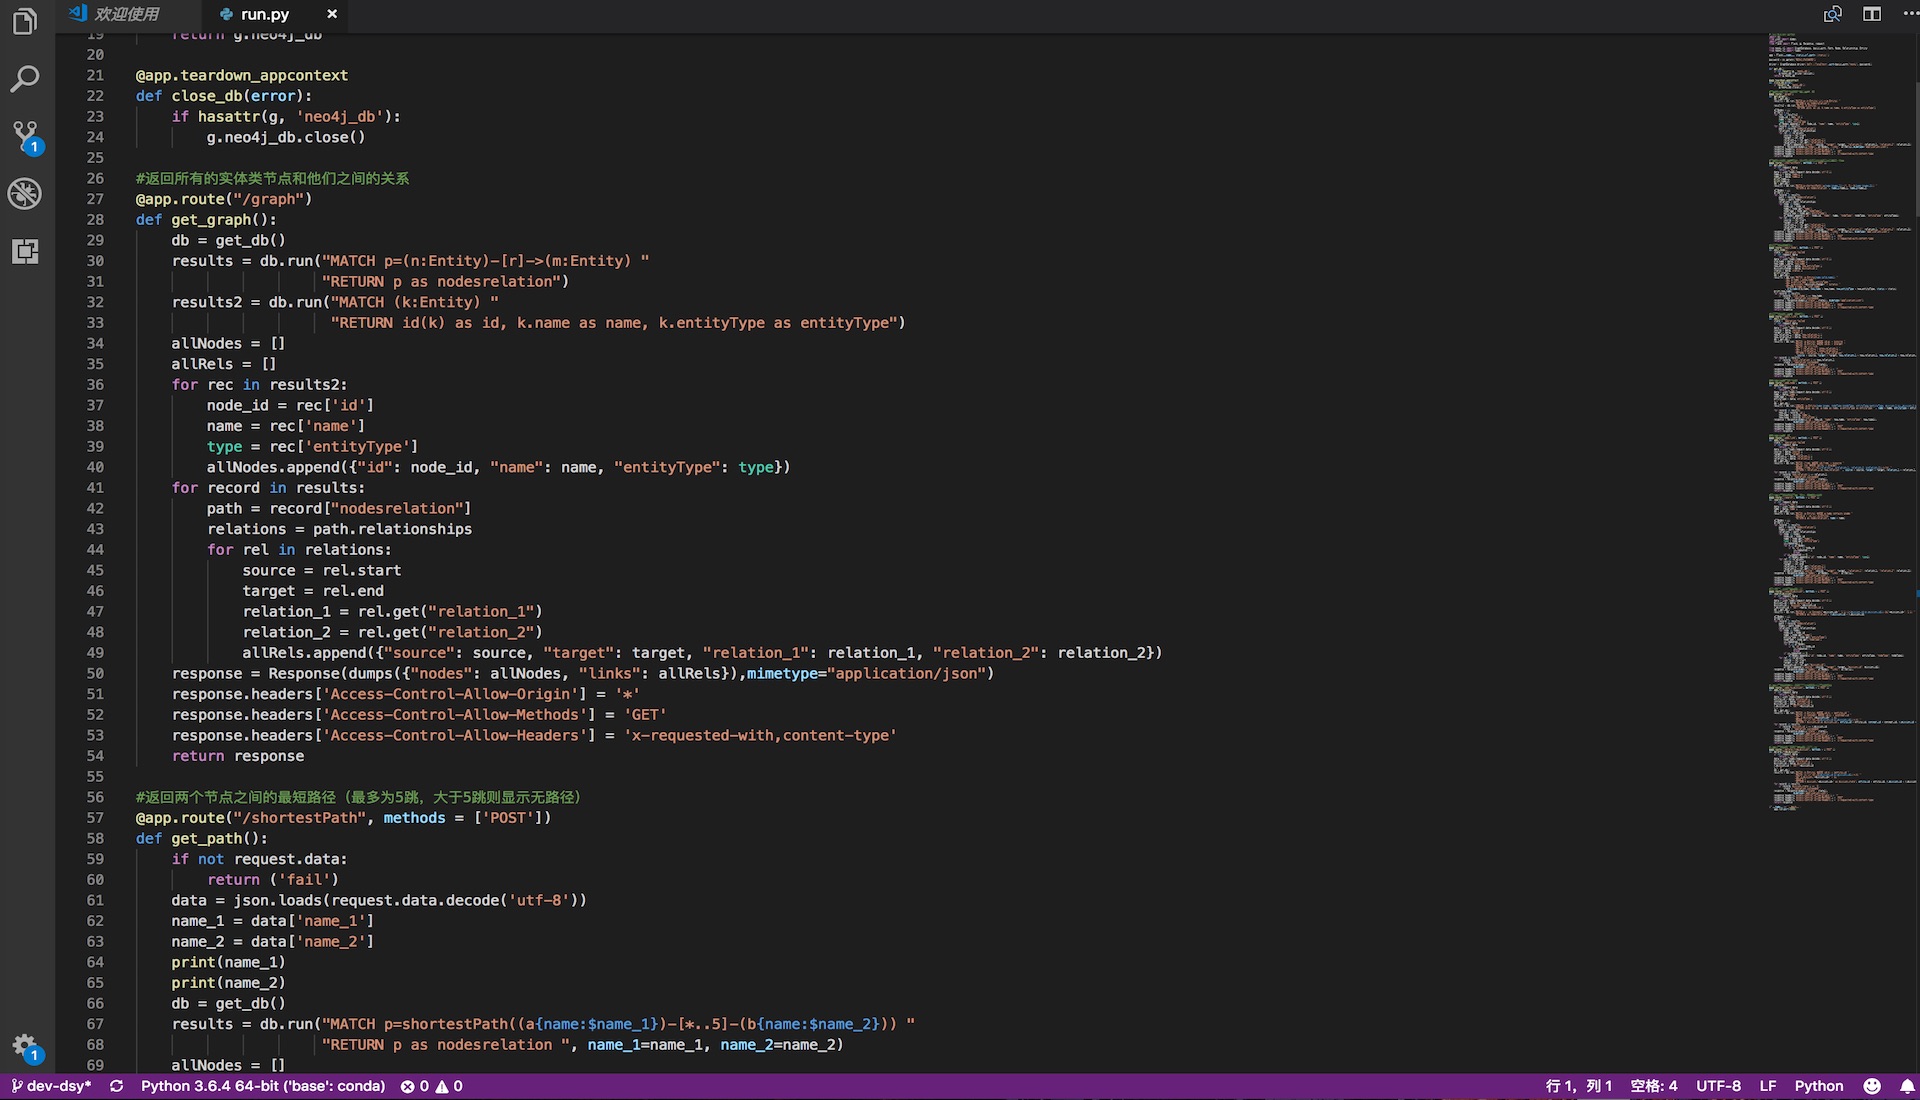
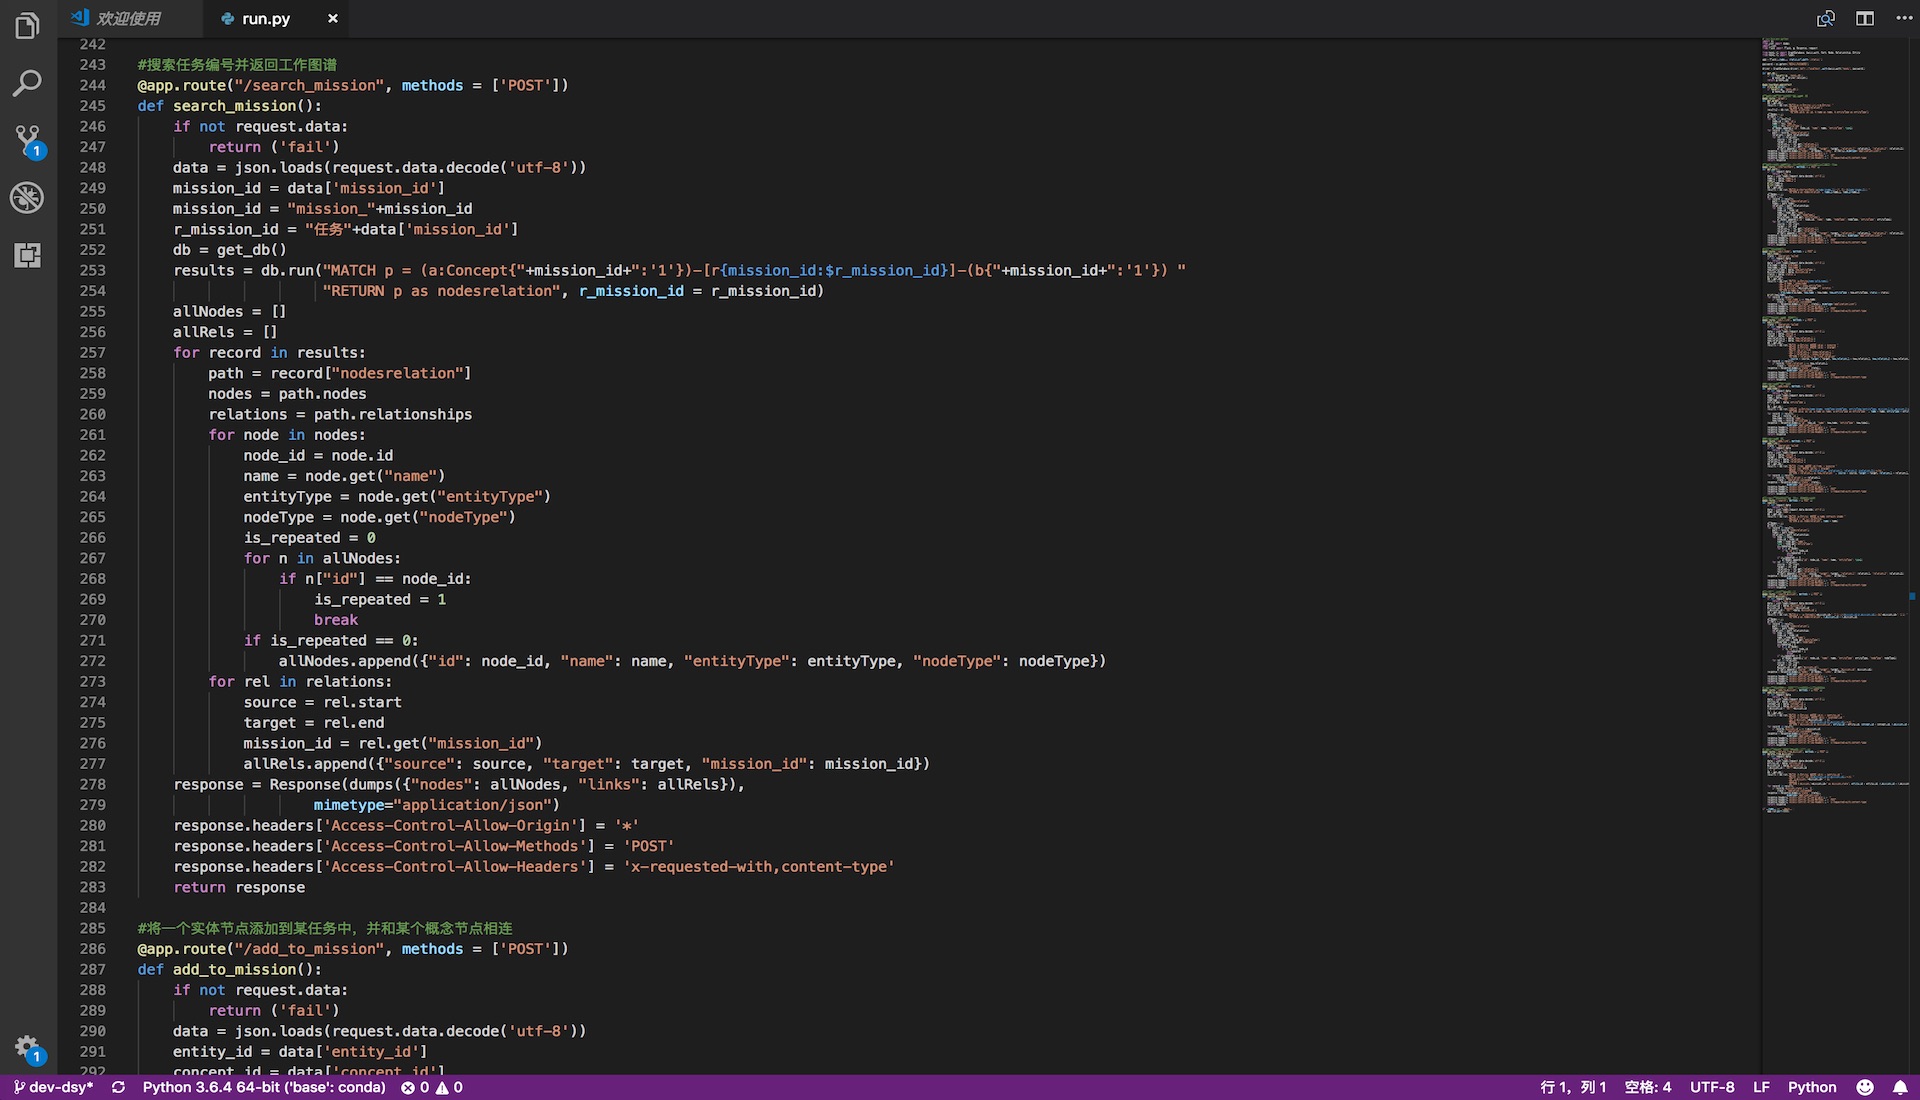
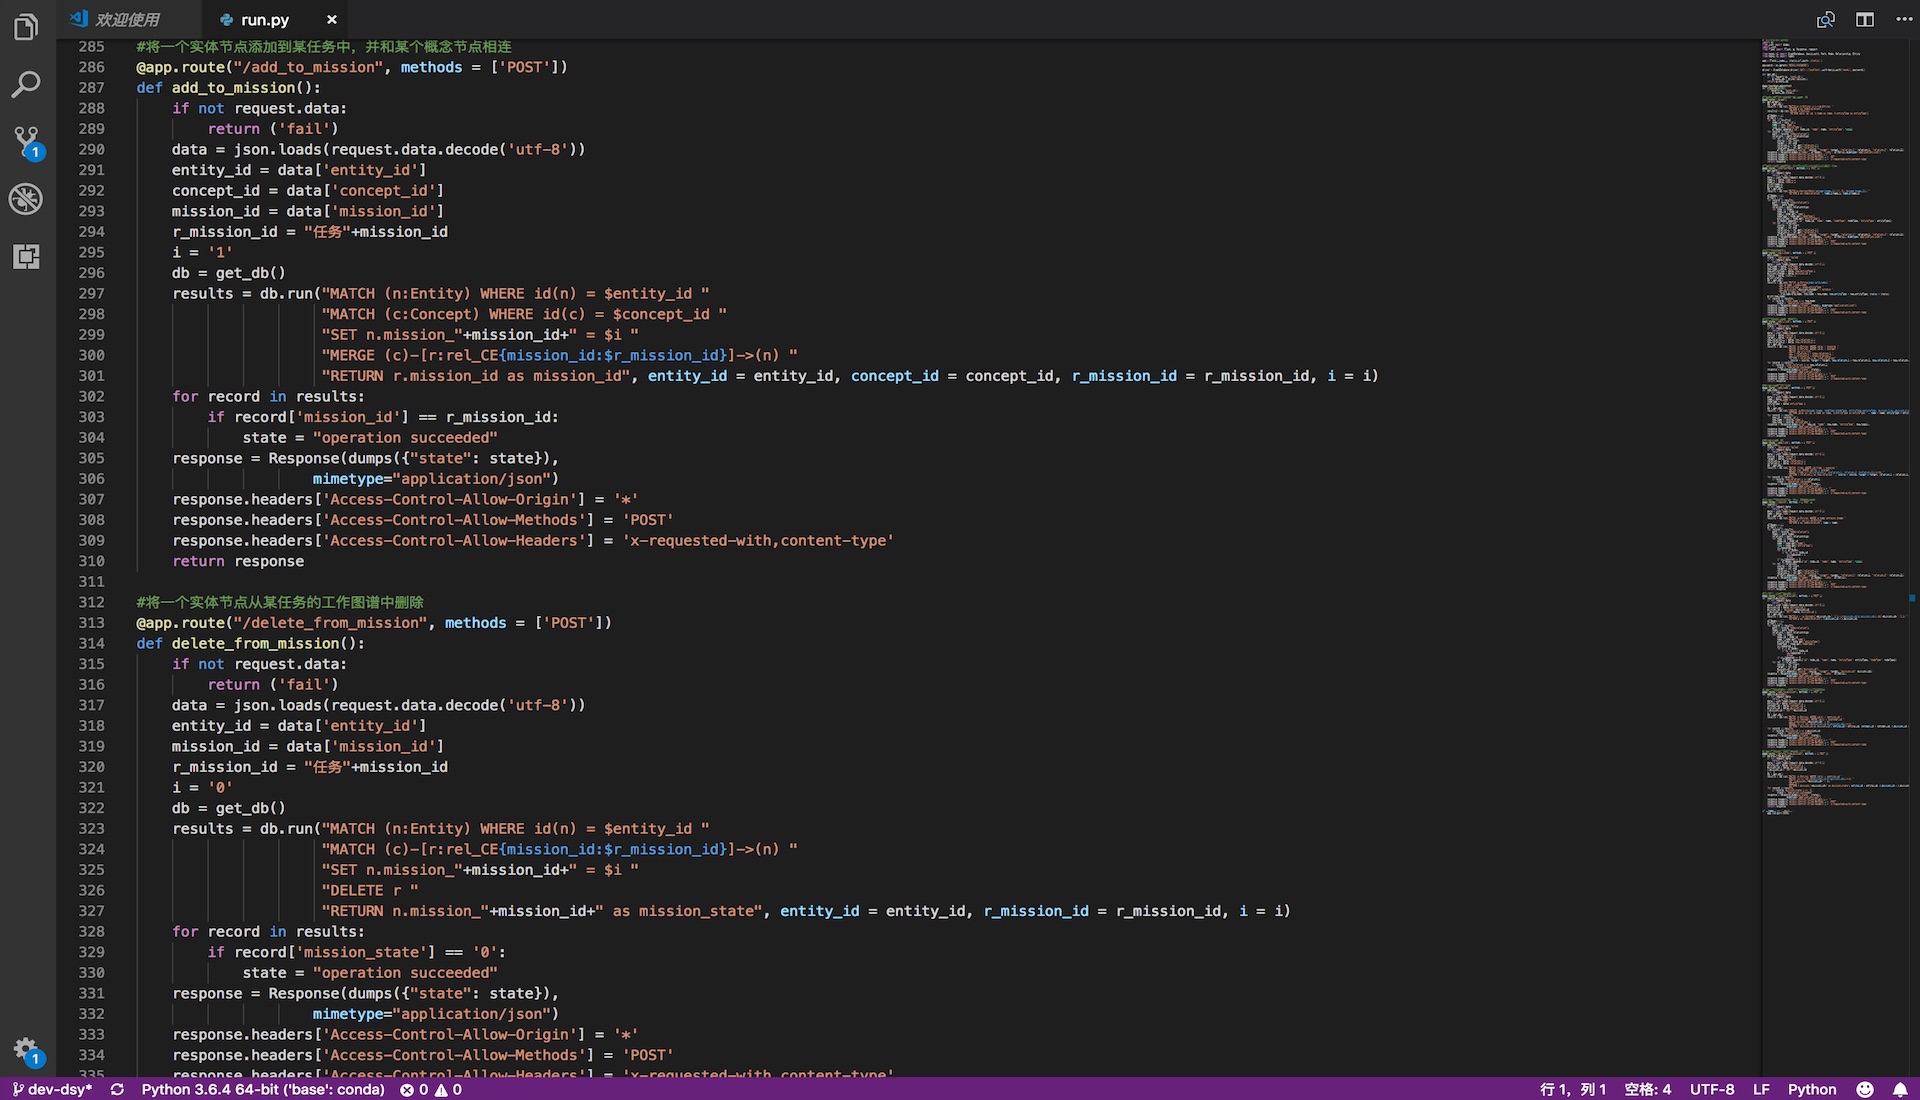
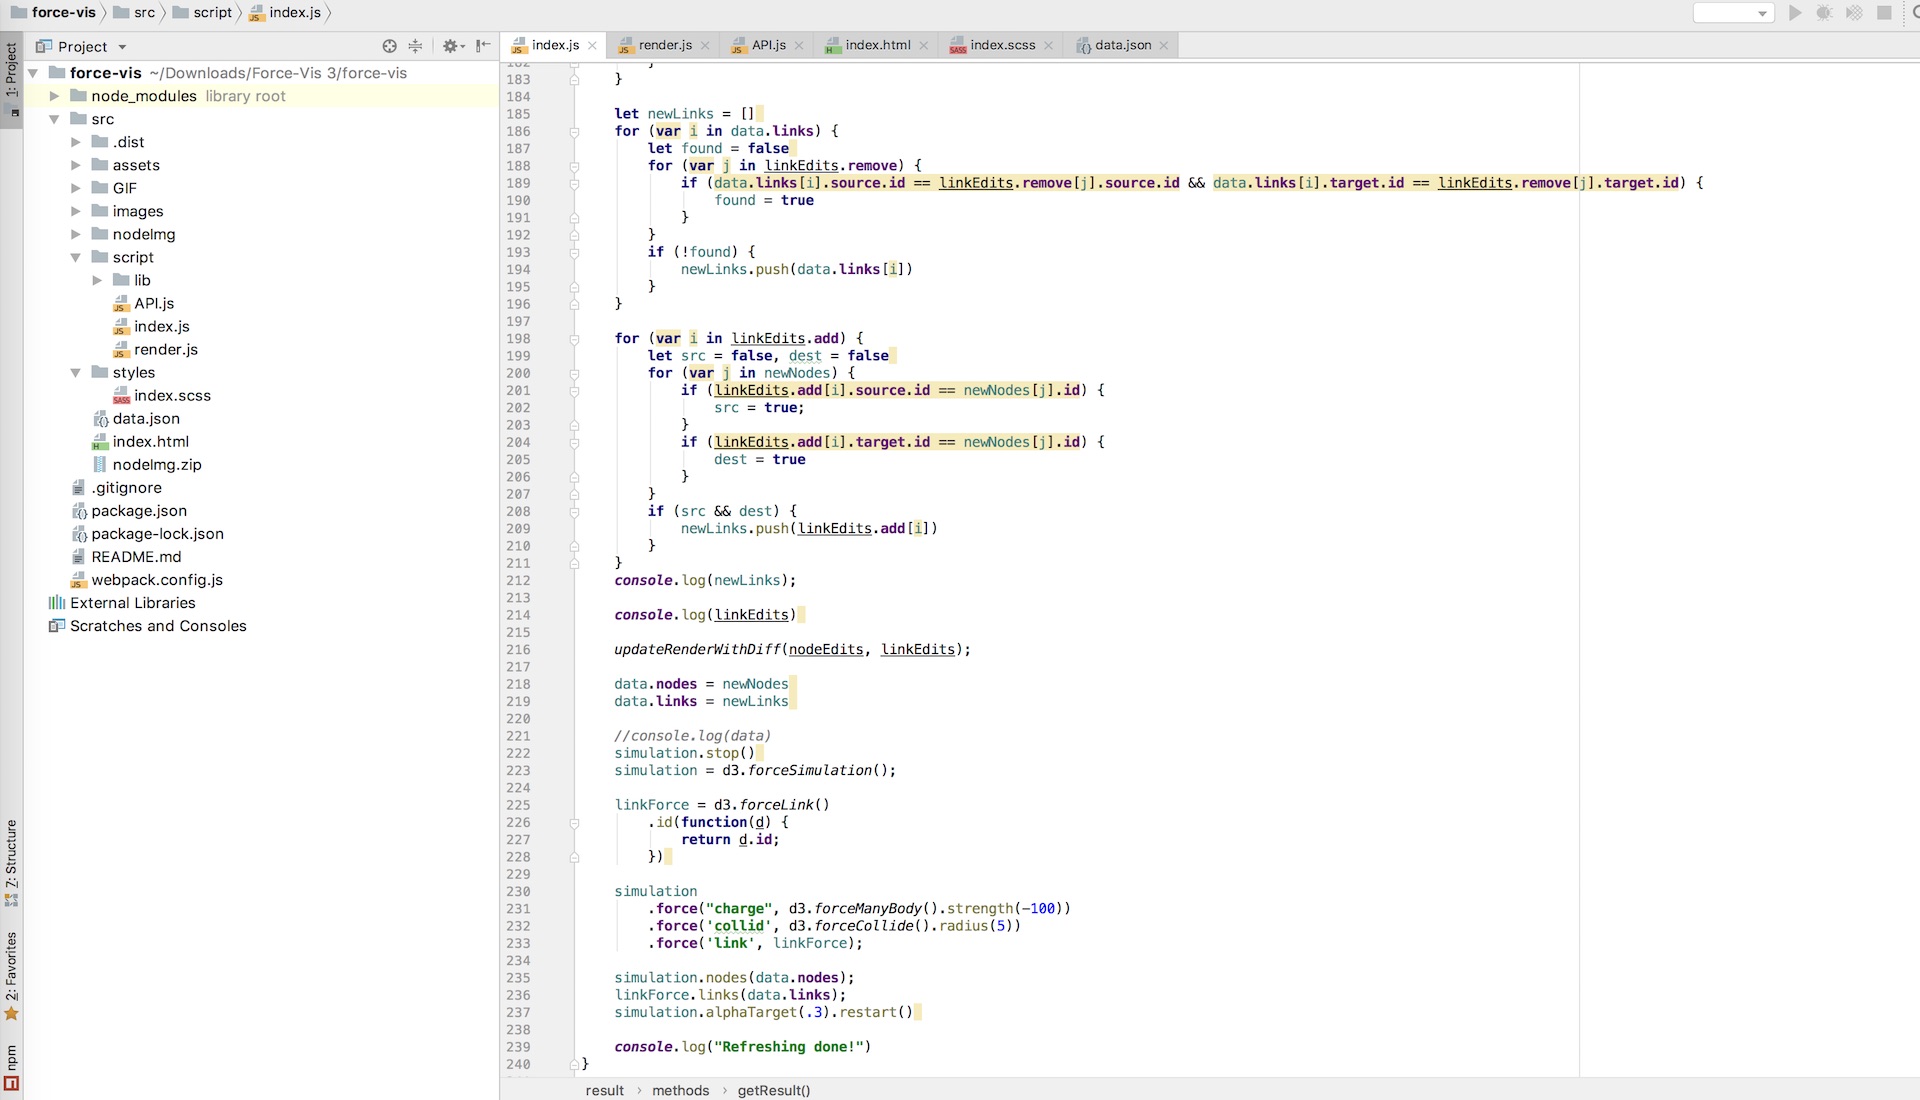
Before involved in this project, I had already get in touch with the concept of knowledge graph, and developed 2 small web applications using KG. In these 2 projects, I used Neo4j[1]--a graph database management system, which is the currently most popular graph database according to DB-Engines Ranking[2]. Before importing the data into Neo4j, I used ETL to pre-process the source data, decreased the data size form 16 million to 14 million by deleting the useless bidirectional relationships. In the back-end, I used Neo4j Driver and Spring MVC[3] framework to access the database and provide the APIs for front-end. In the front-end part, I used Vue CLI[4] framework, Bootstrap[5], Element UI[6], and used JavaScript library like d3.js[7] and Three.js[8] to visualize the knowledge graph.


Project Analysis

In order to gain a comprehensive understanding of the problem and construct proper test cases for our design and evaluation, we first conducted interviews with experts in the relevant field. We interviewed 2 senior researchers whose research focuses on application of knowledge graphs in service robots, and 2 robotics engineers that have expertise in development of service robots and proficient familiarity with knowledge graph technology.

The interview consists of individual interviews and one group discussion session. We asked our participants (1) what are the typical errors that arise with the application of knowledge graphs, (2) what types of correction would benefit the service robot's functioning, and (3) the typical software analytical interface that a KG component would provide.

The result of the interview is too long to put it in this page. If you want to get further information about the interview, please click here


Design & Development

System Design

Based on the analysis of the interviews and sample dataset, we identified three design goals:

D1. Provide effective means for users to navigate, explore and manipulate the personalized knowledge graph.

D2. Provide a visual metaphor that is simple and informative, while maintaining direct relationship with the underlying knowledge graph without requiring lossy translation.

D3. Provide a design that is resource-friendly and portable that can be applied to a wide variety of service robots.

To address these design goals, we present an interactive visual analytics tool that enables users to navigate, explore and manipulate the personalized knowledge graph of service robots and aiding its construction in the process. We first introduce a new structure named a “Working Knowledge Graph (WKG)” to limit the scope of visualization and user interaction down to a more manageable level for non-expert users. The design of the system’s interface is then presented. The interface consists of three main components: an interactive visualization panel that the user mainly operates on, a input panel for searching and creating entities, and an detail panel for displaying and editing more detailed information of entities and relations.


System Development

In the first demo of this project, I first import the data from csv into a local Neo4j database server. Then, I used Python Flask framework to develop the back-end, which provided 6 APIs. In the visualization part, I used the force directed system in d3.js to initialize the x&y-coordinates of the nodes and links, and continue update them. Besides, I used paper.js to realize the hyperbolic projection. The video below shows the interactive functions of the demo.